


Table of Contents
The paper that has the same title with this post is recently appeared in the journal Environmental Microbiology by Sandra L. McLellan et al.. Its aim is to contribute to the discussion of how can we detect human faecal contamination in environmental samples using 16S rRNA gene amplicons, and whether there are any specific, indicative species.
Identifying the source of faecal contamination is an outstanding issue. One of the biggest concerns is to detect human faecal contamination. From the public health perspective, it is very important to know whether human faecal material-associated pathogens may be found in fresh water resources or farm lands.
To test an environment for human faecal material, we have been relying on bacterial organisms that are very abundant in human gut, and not naturally occuring in water and soil, such as E. coli. But E. coli has a very limited specificity, since it is also a part of the gut community of many other animals. Lack of specificity means that when you detect E. coli in an environmental sample, you can’t tell confidently that the area is contaminated with human material, which has implications on administrative decisions.
In the study, McLellan and her colleagues suggest that the genus Blautia in Lachnospiraceae family may contain bacterial organisms that are specific to the host, therefore can be used to decet human contamination in environmental samples more accurately. But the taxonomic resolution is the limiting factor if one expects to find one named organism for each source. To overcome this problem they used oligotyping in the paper to identify closely related but distinct organisms among sequencing reads that were identified as Blautia during the taxonomic classification, and I helped them with the analyses of their datasets.
We used 152,730 quality-controlled reads from 132 samples (including human, sewage, chicken and cow samples). These reads were coming from the V6 region of the 16 rRNA gene, and were identified as genus Blautia. Then we oligotyped them. Oligotying process identified 108 oligotypes, distribution of which among these samples looked like this (Figure 6 in the original paper by McLellan et al.):
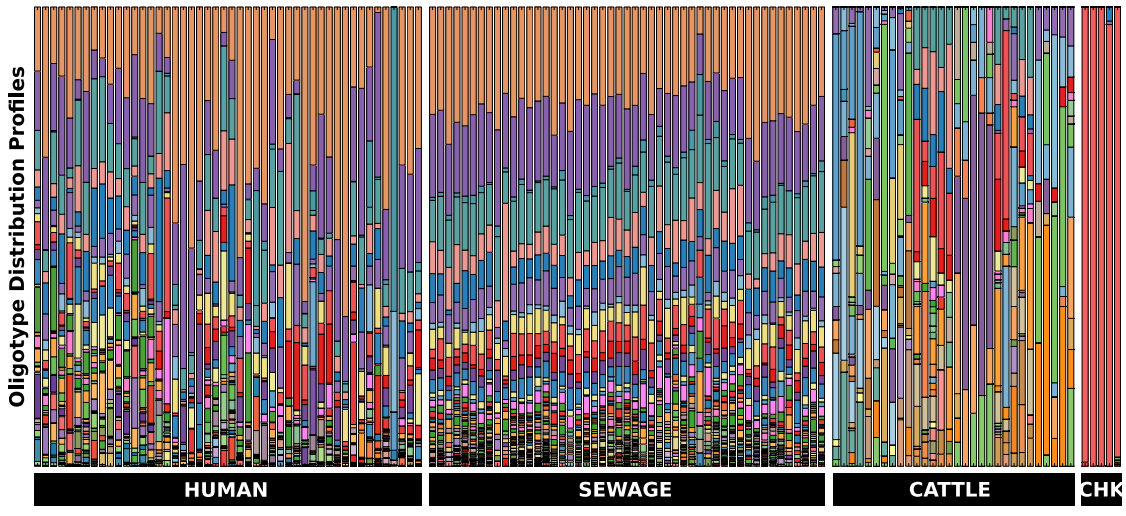
This is how the caption of this figure reads:
Stacked bar chart of oligotypes among groups of samples. Each bar in the figure represents a sample and each colour denotes a different oligotype. Bars at the bottom indicate sample sources.
Among all the reads that were identified as Blautia by taxonomic analysis, now you can see that there are certain colors (oligotypes) that seem to be human specific. And the sewage samples very nicely resemble the human Blautia distribuiton, and present, somewhat expectedly, less variation from sample to sample (since everything is being mixed together in the sewage, it ameliorates the inter-personal variation we observe among humans). Meanwhile cows and chickens have their own distrubtion profiles that seem to be different than human-associated Blautia profiles.
But it is not easy to see ‘specificity’ of certain oligotypes when there are many colors. This figure clarifies that (Figure 7 in the original paper by McLellan et al.):
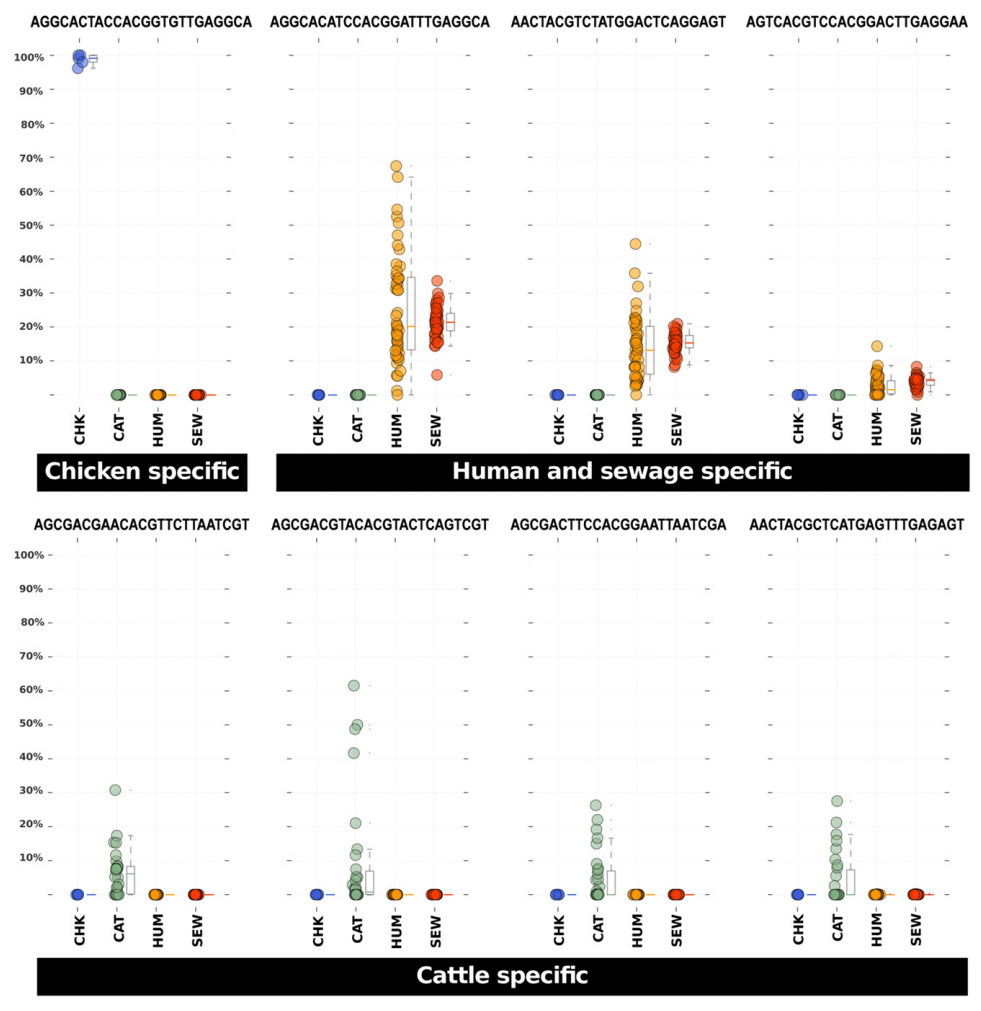
And here is how the caption reads:
Relative abundance representations among sample sources for eight Blautia host-specific oligotypes. Each dot in these panels represents the relative abundance of the listed oligotype (above each plot) among all Blautia assigned sequences in a faecal sample collected from a CHK = chicken (blue), CAT = cattle (green), HUM = human (orange) or a SEW = sewage influent sample (red). Box plots next to the dots provide the 25% and 75% and median relative abundance values for the samples. Whiskers represent 1.5 times the 25% and 75% quartile range.
If you are curious, you can take a look from Table 3 in this open-access paper to get the full-length V6 reads these oligotypes refer to.
This study demonstrates a very efficient way of using the oligotyping method.