


Table of Contents
Myself, Jessica Mark Welsh, Gary Borisy and Susan Huse, have done a comprehensive (re)analysis of the human oral microbiome data generated by the Human Microbiome Project using oligotyping. Our findings are published in PNAS:
http://www.pnas.org/cgi/doi/10.1073/pnas.1409644111
Meanwhile, Carl Zimmer just published an inspiring article mentioning our study, with a great introduction that would be very helpful to anyone who wants to understand the historical issues surrounding bacterial diversity analyses through the 16S rRNA gene-based approaches:
http://phenomena.nationalgeographic.com/2014/06/25/the-zoo-in-the-mouth/
What I will write is going to be some negligible musings about our impressive findings in avery general sense.
Oligotyping is a method that is most efficient when applied to closely related taxa. We have been using oligotyping to reveal diversity patterns of closely related taxa in high-throughput sequencing datasets by mostly analyzing reads that are lumped together in a single genus or a 3% OTU. But this time, we wanted to analyze the entire human oral microbiome dataset using oligotyping. To do that, we oligotyped 6 major bacterial phyla from the human mouth: Actinobacteria, Bacteroidetes, Firmicutes, Fusobacteria, Proteobacteria, and Spirochaetes, which constituted more than 99.75% of all oral microbiome data set, and corresponded to about 6 million reads generated from V3V5 region of the 16S rRNA gene. Briefly, we oligotyped each phylum individually, and merged oligotyping results into a large matrix for further analysis.
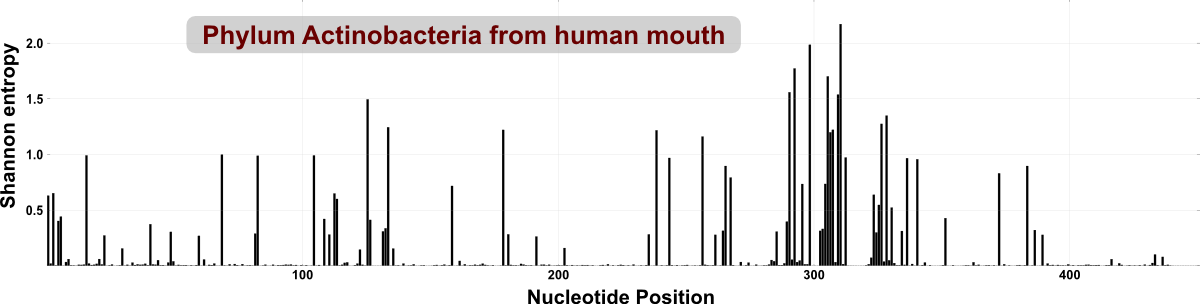
We could analyze an entire phylum with oligotyping (instead of a genus or family) rather easily, because the diversity of even a phylum is quite low in our humanly habitats (such as those within the mouth, or gut) compared to other environments (such as marine or soil samples). To give a visual clue, following figure shows the overall entropy for reads in the HMP dataset that were classified as Actinobacteria (each peak indicates a nucleotide position with high variation):
In comparison, the following figure is the entropy analysis of reads that are classified into phylum Acidobacteria from a soil sample. There are much more entropy peaks, which tells us about the richness of variable sites within this data set:
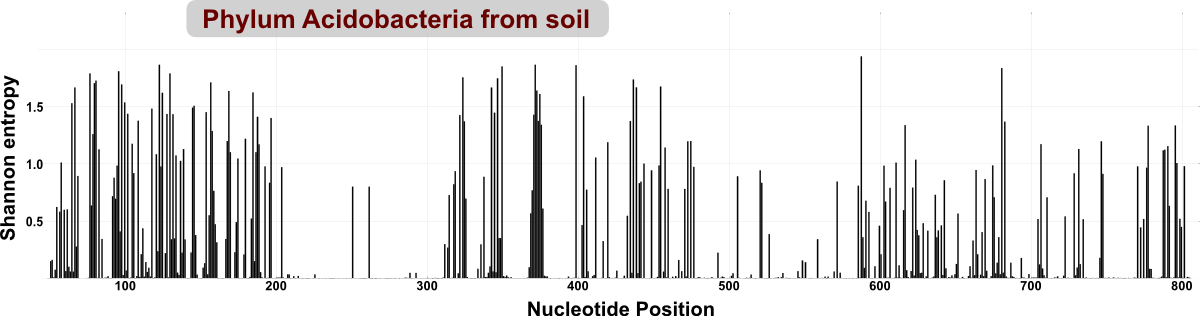
An irrelevant side note: Compared to the human oral microbiome dataset, reads from soil have almost no conserved region across the length of V3V5 region shown here, which is a great reminder of how much diversity we miss from diverse environments when we use primers designed and tested for less diverse environments.
Just like pretty much every other analysis we have done with oligotyping so far, the analysis of human oral microbiome also allowed us to explain the diversity of very closely related taxa that sometimes distributed very unevenly across habitats. For instance, Fusobacterium from Fig 3 demonstrates this phenomenon very nicely. Not only it shows how important subtle nucleotide variation can be, but it also brings many questions into one’s mind regarding more fundamental and theoretical quests within the field microbial ecology.
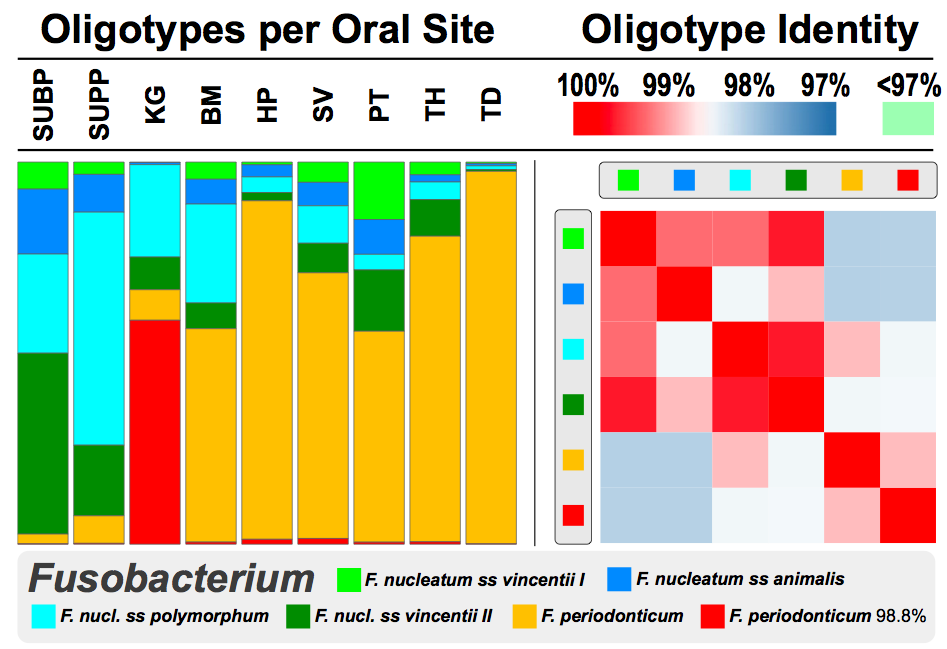
The bars on the left-side show the distribution of 6 oligotypes that are all identified as genus Fusobacterium across 9 mouth sites, namely subgingival plaque (SUBP), supragingival plaque (SUPP), saliva (SV), palatine tonsils (PT), keratinized gingiva (KG), throat (TH), buccal mucosa (BM), hard palate (HP), and tongue dorsum (TD). On the right side, you see the sequence similarity of these oligotypes. One thing that jumps out from this figure is the distribution of that red and orange organisms. From the legend you can see the orange is F. periodonticum, and the red one is also F. peridonticum 98.8%.
That “98.8%” postfix is a way to say “the closest thing we found in the HOMD database for thsi oligotype was F. peridonticum, but this is clearly something else“. And something else it is: while well-characterized and made-it-into-the-database F. peridonticum is found almost everywhere in mouth in high abundances, it is her sister, F. peridonticum 98.8%, who reigns specifically samples collected from keratinized gingiva.
Identification of Fusobacterium is the best you can get with the RDP classifier, one of the best classifiers available that can classify short reads up to genus-level and the one that is used by most studies analyzed the Human Microbiome Project data. Instead of the RDP classifier, we used a more ad hoc approach to annotate the representative sequences of our oligotypes using the Human Oral Microbiome Database, a very comprehensive database maintained by Dr. Floyd Dewhirst of Forsyth Institute and that’s how we could identify the “species” within Fusobacterium. But oligotyping results show that even that wouldn’t have been enough. With RDP results alone, clearly all these bars would have been one color. With the blastn+HOMD results alone, organisms distinguished by red and orange would have been the same color. With both approaches, the identification of the sister Fusobacterium that does better at keratinized gingiva would have been impossible. “Well, how about OTU clustering at infamous 97%?” you may ask. Unfortunately, in this particular case it wouldn’t have given us anything better than the RDP classifier either, since the right panel on the figure reminds us that the representative sequences of all 6 oligotypes are more than 97% similar to each other.
I find it a bit depressing to think that we mostly use taxa or OTUs identified at 97% similarity threshold in our attempts to create our models, generate and test our hypotheses regarding the fundamentals of ecology, or simply try to identify smoking guns of disease states.
This figure, as insignificant as it is in the grand scheme of things, shows that a very small amount of variation can result in completely different functions once again. Then one has to wonder about the fact that, for instance, a UniFrac analysis would have treated the orange and red organisms almost identically, as they would have been very close to each other in the “common phylogeny” even if they could have been identified as distinct organisms as we did through oligotyping.
Yes, 16S rRNA gene is not the ultimate marker to identify each different microbial genome in an environment with all the sensitivity and specificity issues associated with it. But with our general bioinformatic approaches we are not much better than the poor 16S, as we can’t fully exploit the data we have, even when the regions we sequence happen to be sensitive/specific enough to say more about the ecology.
Results of our analysis in this study will not surprise the most. I think anyone who knows anything about microbiology could appreciate the importance of subtle nucleotide variation. Yet, we had to deal with random sequencing errors that poisoned our precious diversity estimates by inflating the number of operational taxonomic units we found in our dataset, and to kill a beast, we summoned another one. But I guess the salient point I would like to finish with is that our study demonstrates once again that a comprehensive understanding in microbial ecology through marker genes must include a fair treatment of subtle nucleotide variation. I hope the ecologically important information oligotyping helped us recover from the human oral microbiome will intrigue other investigators to take a second look from their microbiome data sets.
These are truly exciting times to work with microbes, and I thank every scientist whose work allowed us to do what we can do today.