Table of Contents
Oligotyping pipeline generates all necessary files the user may need to investigate the distribution of the recovered oligotypes among their samples in other analysis environments (such as R).
Although you have the necessary information to explore beta diversity of your samples with respect to oligotypes, it would not be completely useless to have a quick idea about the big picture. That’s why with the new version of oligotyping pipeline, it is possible to provide a mapping file. Using the information in mapping file, oligotyping pipeline generates NMDS plots at the end of the analysis to visualize similarities or dissimilarities in data based on oligotypes recovered.
Format of the mapping file
In order to use mapping function,
- There should be at least 3 samples in your dataset,
- The mapping file must only contain categorical data.
The mapping file is essentially a TAB-delimited file that contains information about every sample you have in the analysis. For instance, this would be an appropriate mapping file for the mock samples used in this article:
samples	environment
Environment-01	A
Environment-02	A
Environment-03	A
Environment-04	A
Environment-05	A
Environment-06	B
Environment-07	B
Environment-08	B
Environment-09	B
Environment-10	B
There are two major requirements for the mapping file:
The first row of the first column must be ‘samples’ (and sample names listed in the first column must match the sample names in the FASTA file), Every entry in every row must be separated by a TAB character (so, it is supposed to be a TAB delimited file, which can be exported from R or EXCEL easily).
IMPORTANT NOTE for MAC users: When you export a TAB-delimited text file from EXCEL, it will not work properly with the pipeline, since EXCEL fails to insert proper “newline” characters into these files. There are many ways to fix the file, but you are not familiar with this issue, I would suggest you to download dos2unix program, which is a tiny command line tool that fixes this issue masterfully (or find something equivalent by asking your bioinformatician friends).
If you wish, you can create a mapping file by first running your oligotyping analysis without a mapping file, and then using the matrix-counts.txt file as a template removing all columnts but the first one.
Letting the pipeline know that you have a mapping file
Once you have your mapping file ready, all you need to do is to add -E mapping.txt to your parameters when you run oligotyping, and you will see new sections included in your HTML-OUTPUT.
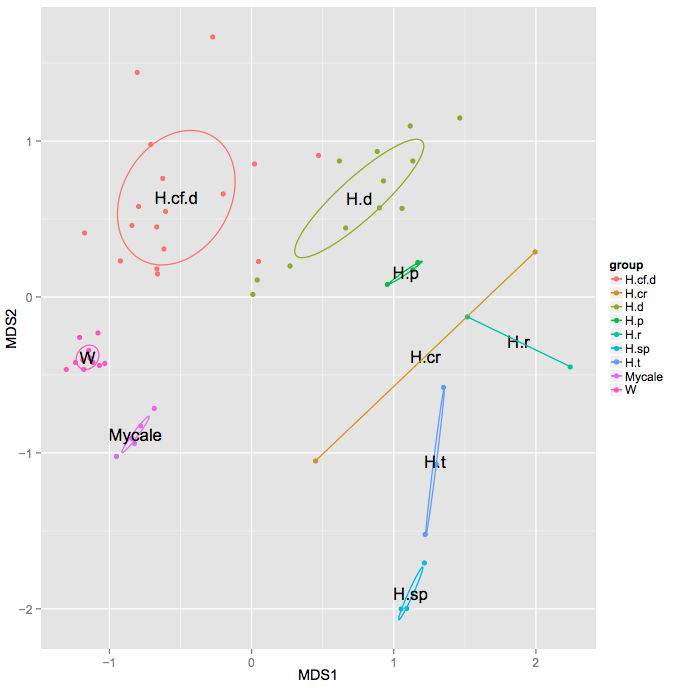
Each variable defined in the mapping file becomes a subsection in the Exclusive Analyses section of your HTML output, under which NMDS plots with 5 different distance metrics will be shown. Samples are being colored depending on which category they belong to, and dispersion ellipses are being drawn to visually explain the similarity or dissimilarities of different groups.
Here is an example analysis result that shows the groups of deep and shallow sea sponge species based on oligotypes found in one genus by Julie Reveillaud: