
Table of Contents
Bar charts, pie charts, NMDS plots, dendrograms are all nice, but I like exploring new ways to visualize complex data. Network theory is an ancient area of computer science that is very useful to explere the structure of relationships between interacting entities in a pool of information.
Biologists are familiar to network analyses mostly because they are commonly used to describe and understand gene regulatory networks, however they are surprisingly under-utilized in microbial ecology and metagenomics, although they would perfectly fit to the nature of the data microbial ecologists deal with.
Cytoscape is one of the most well-known network analysis and visualization software. However, I was not very impressed with it for various reasons. Recently I found out about Gephi, another open-source network analysis software, which uses a very well-designed data format: GEXF (Graph Exchange XML Format).
I played with GEXF and Gephi, wrote some ad-hoc scripts to generate appropriate GEXF files for existing analysis I’ve done recently. I was very impressed with what Gephi could do and finally convinced that it was time for oligotyping pipeline to support network analyses by providing the XML file that can be imported from within Gephi. So, code were written and commits were made: oligotyping pipeline now generates a standard output file named NETWORK.gexf in the analysis directory.
In the next half I’ll give an example hoping to tempt you to try it.
I’ve been working on human oral microbiome samples with Jessica Mark Welch from the MBL.
We recently oligotyped 7 major phyla in oral microbiome samples collected from more than 150 healthy individuals. Well, oligotyping is a method to analyze very closely related organisms, but if you really know what you are doing, you can use it to explain diversity in a phylum as well.
One of the 7 phyla we worked with was Firmicutes, which is one of the most abundant phyla in human mouth. Oligotyping of 2,831,575 V3V5 reads that were identified as Firmicutes resulted in 143 oligotypes and, with the last addition to the pipeline, a NETWORK.gexf file.
Network file oligotyping pipeline generates contains the information about the relationship between samples and oligotypes. Each edge that connects an oligotype to a sample, and is weighted by the percent abundance of the oligotype in that sample, which makes it possible to analyze the distribution of samples using a force-directed algorithm (such as Fruchterman-Reingold, which is available in Gephi). If you provide a sample mapping file, netwrok file is generated to include extra attributes for your nodes that you can use to generate different perspectives while using it in Gephi.
Here is a figure I generated from the network analysis of Firmicutes oligotypes:
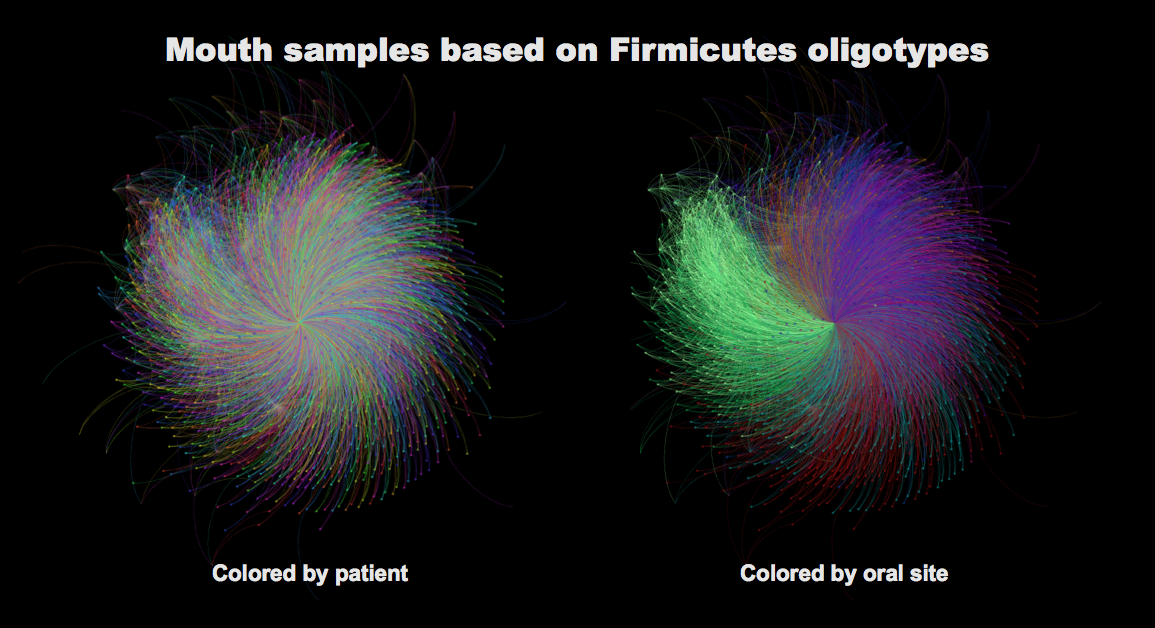
Each little circle in this figure represents a mouth sample (so, for every single individual there are about 9 circles). The right and the left panel has the identical networks, but I colored the one on the left by patient (so circles are colored based on which individual they were sampled from), and I colored the one on the right by the mouth site (so circles are colored based on which mouth site they were sampled from).
There is a striking pattern in the second one. Becasue the same oral site in different people more are more similar to each other based on the bacterial populaitons they harbor than the oral sites in one person, which is shown before, and not surprising, but still beautiful, and validates the accuracy of oligotyping.
To generate a more comprehensive description of oral microbiome dataset with oligotyping, I concatenated the environment files from the oligotyping results of all phyla. The purpose of the actual analysis we are working on with Dr. Mark Welch has nothing to do with networks, but I also generated a new network file from the concatenated environment file using this script in the codebase, and generated the following figure (which will serve as a gift after being printed and framed):
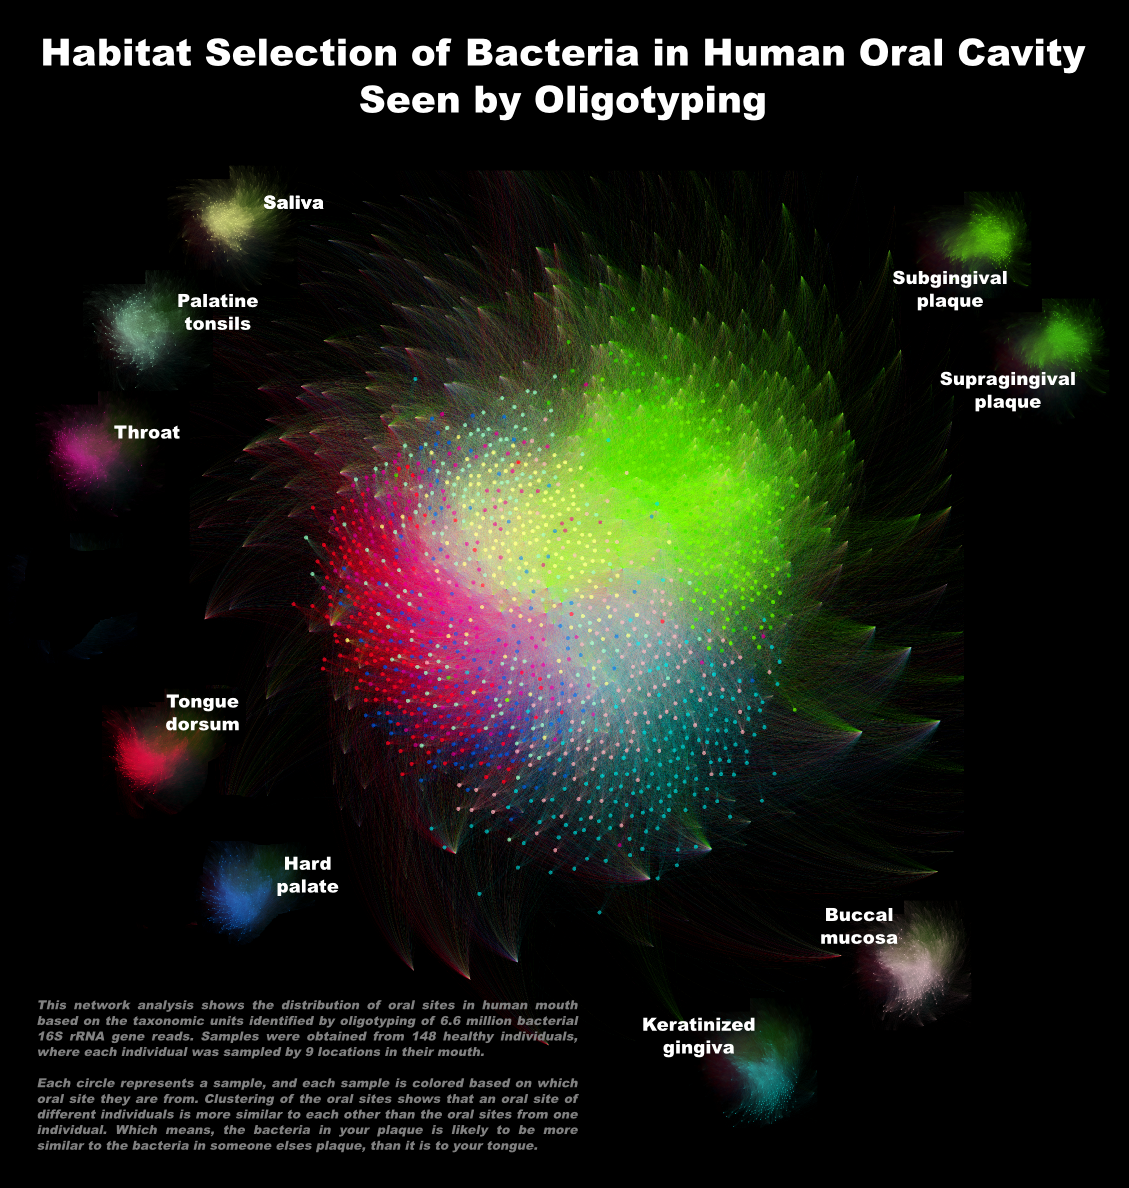
A side node: Network analysis of samples based on oligotypes shows almost a perfect concordance with the result of metagenomics analysis of the same samples.
You can download Gephi here.
Please consider donating to Gephi if you use it and find it useful.