


Table of Contents
We just released the new anvi’o v2.2.2. If you would like to see why you should use this version, you can read the full release notes here.
Among other goodies, this release comes with a much improved version of good ol’, memory-slayin’, single-threaded profiler. Just like the way the previous version of the profiler was absolutely my fault, this new and improved profiler is absolutely Özcan’s success. Although Özcan has been a long time developer of anvi’o, he just recently officially joined the lab. While we thank Özcan for his excellent contributions to the anvi’o codebase, we do not excuse him for not contributing the gender diversity of our lab. Bursts into tears.
The old profiler
OK. The old profiler was a single-threaded program that went through each entry in a given BAM file one by one, kept all intermediate results in the memory, and finally wrote everything into the disk once the processing of all data was finished.
The lack of parallelism made it very slow, and the lack of occasional disk access made it very memory-inefficient. Sadly, for very large metagenomes, our memory usage often exceeded the terabyte limit. Although this has always been unacceptable for us, and the solution was clear, making it happen took longer than it should. But here we are!
The new profiler
In contrast, the new profiler can process data in multiple threads, and does allow the user to plan a trade-off between the memory use and speed. For these, there are two new parameters: --num-threads, and --write-buffer-size. It also shows the actual memory usage of the profiler, so you can see what’s up:
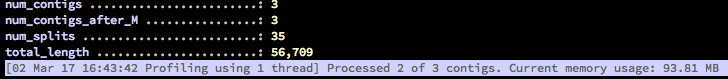
The key is to avoid using too much memory for your system’s norms to make sure your operating system does not start relying on the swap disk space.
–num-threads
When we have unlimited resources, the increasing number of threads decrease the amount of time it is required to process all data:
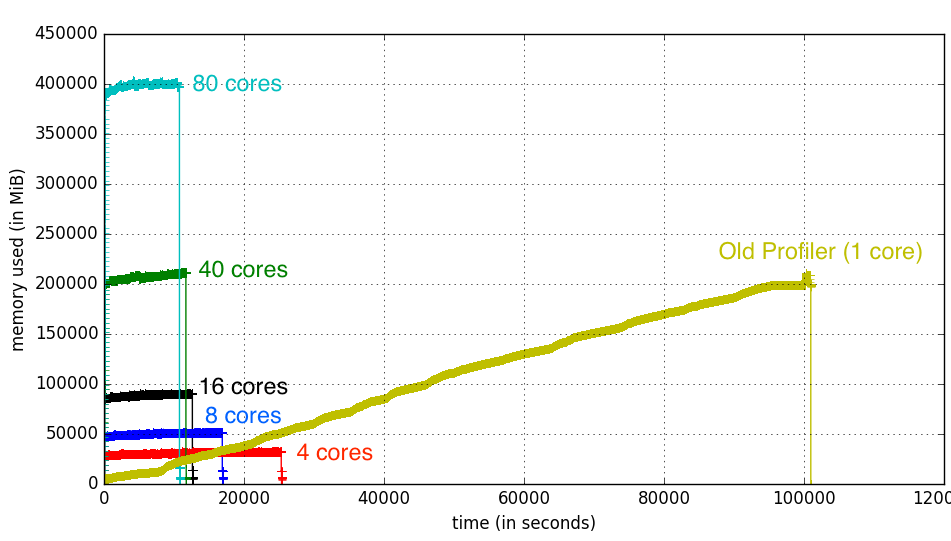
Each line in the figure above represent the memory usage of the process for the old profiler (the one in ugly yellow) versus the new profiler with changing number of threads. The X-axis represents how long a given process took, and the Y-axis shows the amount of memory it used.
As you can see, while the memory usage increase almost linearly with the number of threads, the gain in processing time does not decrease as rapidly with the increasing number of threads, and 16 threads seem to be the sweet spot. This is most probably due to the overhead of maintaining too many processes. You know how a problem that takes a single person 4 hours to solve, takes 2 hours to solve for two people, and 6 hours to solve for three? It is kinda like that, but not as bad. Simply because computers are much better than people even at their worst. Bursts into tears again.
Just for historical reasons, here is how Özcan initiated each of the profiling runs to generate cures above:
# The old profiler:
anvi-profile -i TEST-DATA.bam -c TEST-CONTIGS.db

# Test runs with the new profiler:
anvi-profile -i TEST-DATA.bam -c TEST-CONTIGS.db --num-threads 4
anvi-profile -i TEST-DATA.bam -c TEST-CONTIGS.db --num-threads 8
anvi-profile -i TEST-DATA.bam -c TEST-CONTIGS.db --num-threads 16
anvi-profile -i TEST-DATA.bam -c TEST-CONTIGS.db --num-threads 40
anvi-profile -i TEST-DATA.bam -c TEST-CONTIGS.db --num-threads 80
–write-buffer-size
Because we don’t have unlimited resources, we have --write-buffer-size. The parameter you define for the write buffer size answers the question “how many items should the profiler keep in memory before writing them to the disk”. If the write buffer size is larger than the number of contigs in the BAM file, the profiler will keep everything in memory until the end of the run: minimum disk I/O, maximum speed and memory usage. If the write buffer size is very small, let’s say it is --write-buffer-size 1, the profiler will write every processed contig to the disk as soon as they are finished: the memory use will never exceed the amount of memory used for a single contig in your project, but the number of disk I/O will be maximum.
Here is how the same dataset above goes with different --write-buffer-size values:
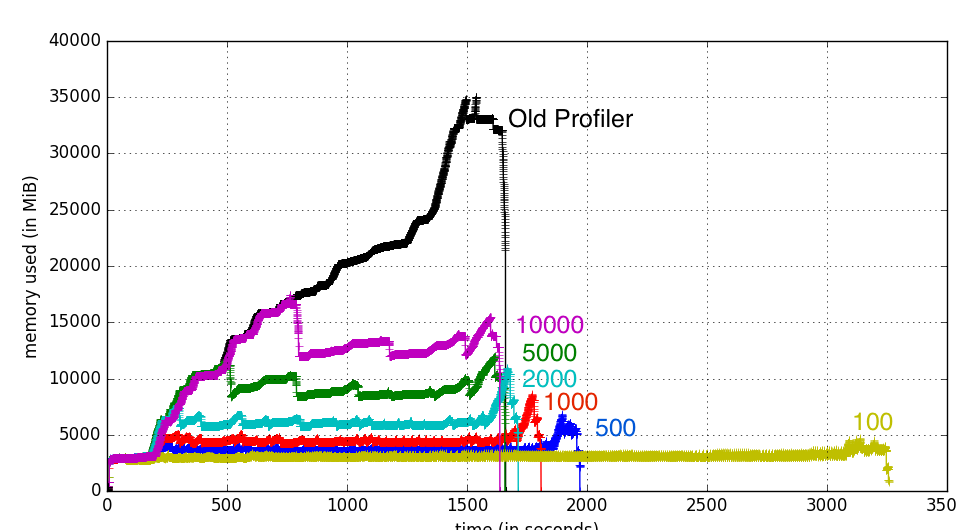
You don’t gain much more speed with increasing write buffer size, but lowering it is a very efficient way to keep the memory usage to a minimum for a given profiling run.
Again, here is how Özcan initiated each of the profiling runs to generate cures above:
# With unlimited buffer size:
anvi-profile -i TEST-DATA.bam -c TEST-CONTIGS.db  --num-threads 4 --write-buffer-size 0

# Test runs with varying buffer sizes:
anvi-profile -i TEST-DATA.bam -c TEST-CONTIGS.db  --num-threads 4 --write-buffer-size 100
anvi-profile -i TEST-DATA.bam -c TEST-CONTIGS.db  --num-threads 4 --write-buffer-size 500
anvi-profile -i TEST-DATA.bam -c TEST-CONTIGS.db  --num-threads 4 --write-buffer-size 1000
anvi-profile -i TEST-DATA.bam -c TEST-CONTIGS.db  --num-threads 4 --write-buffer-size 2000
anvi-profile -i TEST-DATA.bam -c TEST-CONTIGS.db  --num-threads 4 --write-buffer-size 5000
anvi-profile -i TEST-DATA.bam -c TEST-CONTIGS.db  --num-threads 4 --write-buffer-size 10000
We hope the new profiler will be useful to you!
Please don’t hesitate to leave a comment if you have questions or suggestions.