
Table of Contents
A note from the Meren Lab: We are very thankful to Mahmoud for not only implementing this beautiful feature in anvi’o, but also taking the time to explain it in such great clarity. Mahmoud is currently a a second year Computer Science major pre-med student at the University of Chicago.
As I’m sure you know, anvi’o is a powerful software that among other things can be used for pangenomics. By inferring similarities between amino acid sequences, anvi’o’s pangenomic workflow identifies gene clusters across closely related mirobial genomes, and allows one to investigate how and where these genomes differ.
Using anvi’o you can ‘inspect’ the alignments within a gene cluste, too. But how about a pangenomic software doing more than simply blurting out amino acid residue sequences? Wouldn’t it be better for the software to tell us when a specific residue is conserved or not conserved across different genomes? And how about the bigger picture –is the protein structure expected to be conserved across different genomes for a given gene even if an amino acid residue is not identical?
To address these needs, I implemented a new feature into anvi’o that will be available with v4. Using this new feature anvi’o will now explicitly label amino acid residues that are conserved across different genomes in a given gene cluster. This is an important insight to have rapidly, as knowing the conservation of amino acid residues and protein structures is equivalent to understanding the extent of the genetic relationship between different genomes.
A little bit of basic biochemistry
What determines the structure of a protein? A protein has four levels of structure:
-
Primary structure: this is the simple linear sequence of amino acid residues that are found in open reading frames in the genome that codes for genes, from the positively charged end to the negatively charged end.
-
Secondary structure: This is the result of charge-charge interactions between polar oxygen (carboxyl) and nitrogen (amino) groups found in every amino acid. These interactions across nearby amino acids cause the 2D folding that stabilizes the protein.
-
Tertiary structure: This is the result of bonding interactions between polar and nonpolar side-chain groups of amino acids. The intricate twisting and bonding of the protein gives it its unique 3D structure, where every amino acid contributes to the function of the protein in some way.
-
Quaternary structure: This is the result of bonding interactions between different polypeptide chains to form a single protein complex.
As we can see, all four levels of a protein’s structure are determined by the properties that the amino acid residues exhibit in that protein.
And what makes the amino acids so special to the point that each one can have a different effect on a protein? The standard genetic code includes 20 amino acids. All of them have a positively charged amino group and a negatively charged carboxyl group. But every amino acid has an extra sequence of atoms that makes it unique from all other amino acids - we call this the R group or the side chain of the amino acid. The R groups differ vastly in properties - some are short and nonpolar, some are long and polar, others have an additional charge to them. It’s these chains that make amino acids so unique in their properties.
So, different properties of amino acids can cause different effects in the structure of a protein. Two polar amino acids can bond together. Two nonpolar cyclic side chains can interact with each other and create a bonding interaction. Replace one of these nonpolar cyclic amino acids with a polar amino acid, and suddenly this bonding cannot take place, and the structure of the protein may change significantly.
Therefore, we say that an amino acid residue is conserved if the structure of the protein is predicted to not change very much based on the changes in this residue. In other words, replacing a small nonpolar amino acid with a slightly smaller nonpolar amino acid is not expected to change the structure of the protein drastically; we can predict that the structure, and thus the function of the protein, is conserved even with this change.
So if there was a way to identify conservancy properly, we could make better sense of heterogeneity across amino acid sequences within a gene cluster.
The algorithm
The algorithm for determining conservation is simple. We align all of the amino acid residues of a single polypeptide chain (which is taken care of per gene cluster by anvi’o if the user did not speficially opted out). We then cross-check a given amino acid residue at a given site with all other amino acid residuies across genes from other genomrs at the same site. If we find that the percentage of gene clusters that are conserved with respect to protein structure is above a certain threshold, we color code it. Otherwise, we give it the default color of black (there will be some examples soon to show how this looks on the interface).
Some amino acids can be compared with different groups of amino acids. For instance, a small, polar amino acid can be conserved with respect to small amino acids or with respect to polar amino acids independently. Such residues only needed to fulfill one of the conservation conditions to be color coded. In almost all of the cases, the color would be the same regardless of the case (cysteine is the exception, which we will discuss soon).
Below is a table of all of the amino acid conservation cutoffs and predicted conserved groups that were used in this algorithm, which I adapted from Clustal X, and edited slightly:
| Amino Acid Residue at Position | Applied Color | Conserved Groups | Minimum Threshold |
|---|---|---|---|
| A, I, L, F, W, V, M (Alanine, Isoleucine, Leucine, Phenylalanine, Tryptophan, Valine, Methionine) | Blue | W, L, V, I, M, A, F, C, H, P | >= 60% |
| R, K (Arginine, Lysine) | Red | K, R | >= 60% |
| Q, K, R | >= 80% | ||
| N (Asparagine) | Green | N | >= 50% |
| N, Y | >= 85% | ||
| C (Cysteine) | Hotpink | C | 100% |
| Blue | W, L, V, I, M, A, F, C, H, P | >= 60% | |
| Q (Glutamine) | Green | K,R | >= 60% |
| Q, E | >= 50% | ||
| Q, E, K, R | >= 85% | ||
| E (Glutamate) | Magenta | K, R | >= 60% |
| Q, E | >= 50% | ||
| E, Q, D | >= 85% | ||
| D (Aspartate) | Magenta | K, R | >= 60% |
| K, R, Q | >= 85% | ||
| E, D | >= 50% | ||
| G (Glycine) | Orange | G | >= 0% (always) |
| H, Y (Histidine, Tyrosine) | Dark Turquoise | W, L, V, I, M, A, F, C, H, P | >= 60% |
| W, Y, A, C, P, Q, F, H, I, L, M, V | >= 85% | ||
| P (Proline) | Yellow | P | >= 0% (always) |
| S, T (Serine, Threonine) | Green | W, L, V, I, M, A, F, C, H, P | >= 60% |
| S, T | >= 85% |
What’s the biochemical significance of each conservation group? And what about the colors? Let’s walk through it:
-
A, I, L, F, W, V, M: all of these are the nonpolar amino acids, with their side chains almost being exclusively hydrogen and carbon atoms. They will have nonpolar bonding effects between each other. Thus, if they are replaced with other nonpolar amino acids, the structure of the protein will be likely conserved. Notice that the conserved group for this case includes these amino acids as well as C, P, and H. These three amino acids are also nonpolar but can exhibit polar bonding effects under certain circumstances. They do prefer nonpolar binding effects when surrounded by nonpolar amino acids, so they will usually conserve the structure of the protein if they take the place of an amino acid residue from this group. The blue color here represents the nonpolar amino acids.
-
R, K: These two amino acids are positively charged in proteins and can act as local acids if needed. They also have very long side chains that can stick into a different part of the protein to stabilize it through acid-base reactions. More commonly, they are found at the active site of a protein enzyme, where they react with reactants through acid-base chemistry to help form the products. These amino acids are conserved with themselves and with Q - an amino acid with a long side chain with a polar nitrogen group in the end. Although this amino acid is not charged, the polarity of the nitrogen can allow Q to act as a base in needed circumstances. The red color ascribed here represents the positively charged amino acids.
-
N: N is a short amino acid with a nitrogen group at the end of its side chain. It is not as polar, and therefore not as reactive as Q. It is conserved by itself, but it can also be conserved by amino acid Y. Y is a short amino acid with a polar oxygen group at the end of its side chain. It holds the same chemical properties as N but is even less reactive. The green color here is for the amino acids that are nonpolar but have a polar molecule at the end of their side chains. These amino acids rarely react through polar mechanisms except when influenced by a really strong acid or base.
-
C: Cysteine is a nonpolar amino acid with a sulfur group at the end of its side chain. It exhibits nonpolar bonding effects, but is unique in that it can link up with other cysteines through sulfur-sulfur covalent bonds (sulfide bridges). These bonds are powerful and can link up cysteines that are much farther away. Cysteine can be conserved by the nonpolar amino acids conservation group from earlier. The blue color given to it indicates that it is conserved with respect to being nonpolar. However, it can also be conserved if cysteine is found in every single sequence of the different species and strains, as it can form the network of sulfide bridges. The hotpink color shows that cysteine is conserved by itself throughout all of the sequences studied (our algorithm checks for conservation by itself before checking for nonpolar residues).
-
Q: Q, as discussed previously, is a long amino acid with a polar nitrogen group at the end of its side chain that can react through acid-base reactions under acidic or basic conditions. Q can be conserved by K, R, E, and itself all to varying degrees. K and R were discussed previously; E is an amino acid with the same structure as Q but with a basic oxygen group instead of the nitrogen group. It’s function is similar to Q, but is much more reactive.
-
E: A long amino acid with a negatively charged oxygen group at the end of the side chain. It is a very strong base and can deprotonate almost anything that comes its way. E is conserved with K and R because of length and polarity. It can also be conserved with Q because it is the (weaker) acidic form of E. Because charges are different, it needs to be conserved to a greater degree for protein structure to be conserved across the different species. It can also be conserved with respect to D, an amino acid that is shorter than E by one carbon link. The magenta color represents the negatively charged amino acids.
-
D: a short amino acid with a negatively charged oxygen group at the end of its side chain. It is a slightly weaker base than E because of its size. For reasons similar to that of E, D can be conserved by K, R, E, Q, and itself. It is also colored magenta.
-
G: G is the shortest and smallest of all amino acids, with its side chain being a simple hydrogen atom. It’s small size and lack of bonding effects greatly disrupts protein structure and often causes twists and turns in the protein. Due to its extremely small size and lack of contribution to protein structure, we can say that it is always conserved with respect to itself (notice, however, that no other amino acid can be possibly conserved with respect to G). The orange color here is specific for G and its lack of bonding characteristics.
-
H, Y: These two amino acids are medium-sized in length with polar groups at the end of their side chains. They can engage in both nonpolar and polar bonding effects. H will sometimes be found with a positive charge, but often won’t. These amino acids are conserved with the nonpolar amino acids. However, they can also be conserved with those amino acids in addition to Q and Y, both uncharged and polar and performing almost the same function in protein structure. The dark turquoise color is intended to be a mixture of blue (for nonpolar) and green (polar ends to the side chain).
-
P: P is an interesting amino acid. Remember how every amino acid has a positively charged nitrogen group in addition to its side chain? Well, P actually connects them in a single ring-like structure. This gives it the unique characteristic of being both nonpolar and polar simultaneously. However, both of these interactions are weakened because P is forced into a tight ring structure. This makes it difficult for P to contribute to protein structure, except when the secondary structure requires a full 180 degree change in direction. Because of this, P is only conserved with itself. This time, we can see that other amino acids are conserved with respect to P. This is because the ring can exhibit weak nonpolar interactions that can be used if it is necessary to keep the structure stabilized. P is colored yellow to indicate that it is in between being polar and being nonpolar.
-
S, T: These two amino acids have nonpolar side chains of medium length that end with a polar group. These two amino acids can exhibit very strong nonpolar interactions, but very rarely have polar bonding interactions. These two amino acids can be conserved with the nonpolar amino acids, as well as themselves for similarity in structure. They are also labelled in green for being mostly involved in nonpolar interactions.
The percentage cutoffs are all estimates as to how much an amino acid contributes to the structure of the protein. In any given residue or any given protein, these values can shift depending on the secondary structure and the folding patterns at that exact location.
The user interface
To demonstrate how this new feature looks like in the anvi’o interactive interface, I will be using the Prochlorococcus metapangenome, all data for which, is available here. For the sake of reproducibility, here is what I did to download and display the Prochlorococcus metapangenome on my computer to use it with anvi’o v4:
# download the pangenome
curl -L https://api.figshare.com/v2/file/download/9416623 \
     -o ANVIO-METAPANGENOME-FOR-PROCHLOROCOCCUS-ISOLATES.tar.gz

# unpack the data
tar -zxvf ANVIO-METAPANGENOME-FOR-PROCHLOROCOCCUS-ISOLATES.tar.gz
cd ANVIO-METAPANGENOME-FOR-PROCHLOROCOCCUS-ISOLATES

# this project was generated anvi'o `v3`, but we want to use it with
# anvi'o `v4`, so we need to upgrade the old databases:
ANVIO_SAMPLES_DB=Prochlorococcus-METAPAN-SAMPLES.db anvi-migrate-db Prochlorococcus-PAN-PAN.db
anvi-migrate-db Prochlorococcus-GENOMES.h5
anvi-import-misc-data ENVIRONMENTAL-CORE.txt -p Prochlorococcus-PAN-PAN.db -t items
Once you have your pangenome ready, you will display it with anvi-display-pan command (more instructions regarding the pangenomic workflow is here).
Here I will display the Prochlorococcus pangenome the following way:
anvi-display-pan -g Prochlorococcus-GENOMES.db \
                 -p Prochlorococcus-PAN-PAN.db
Which gives me this disyplay:
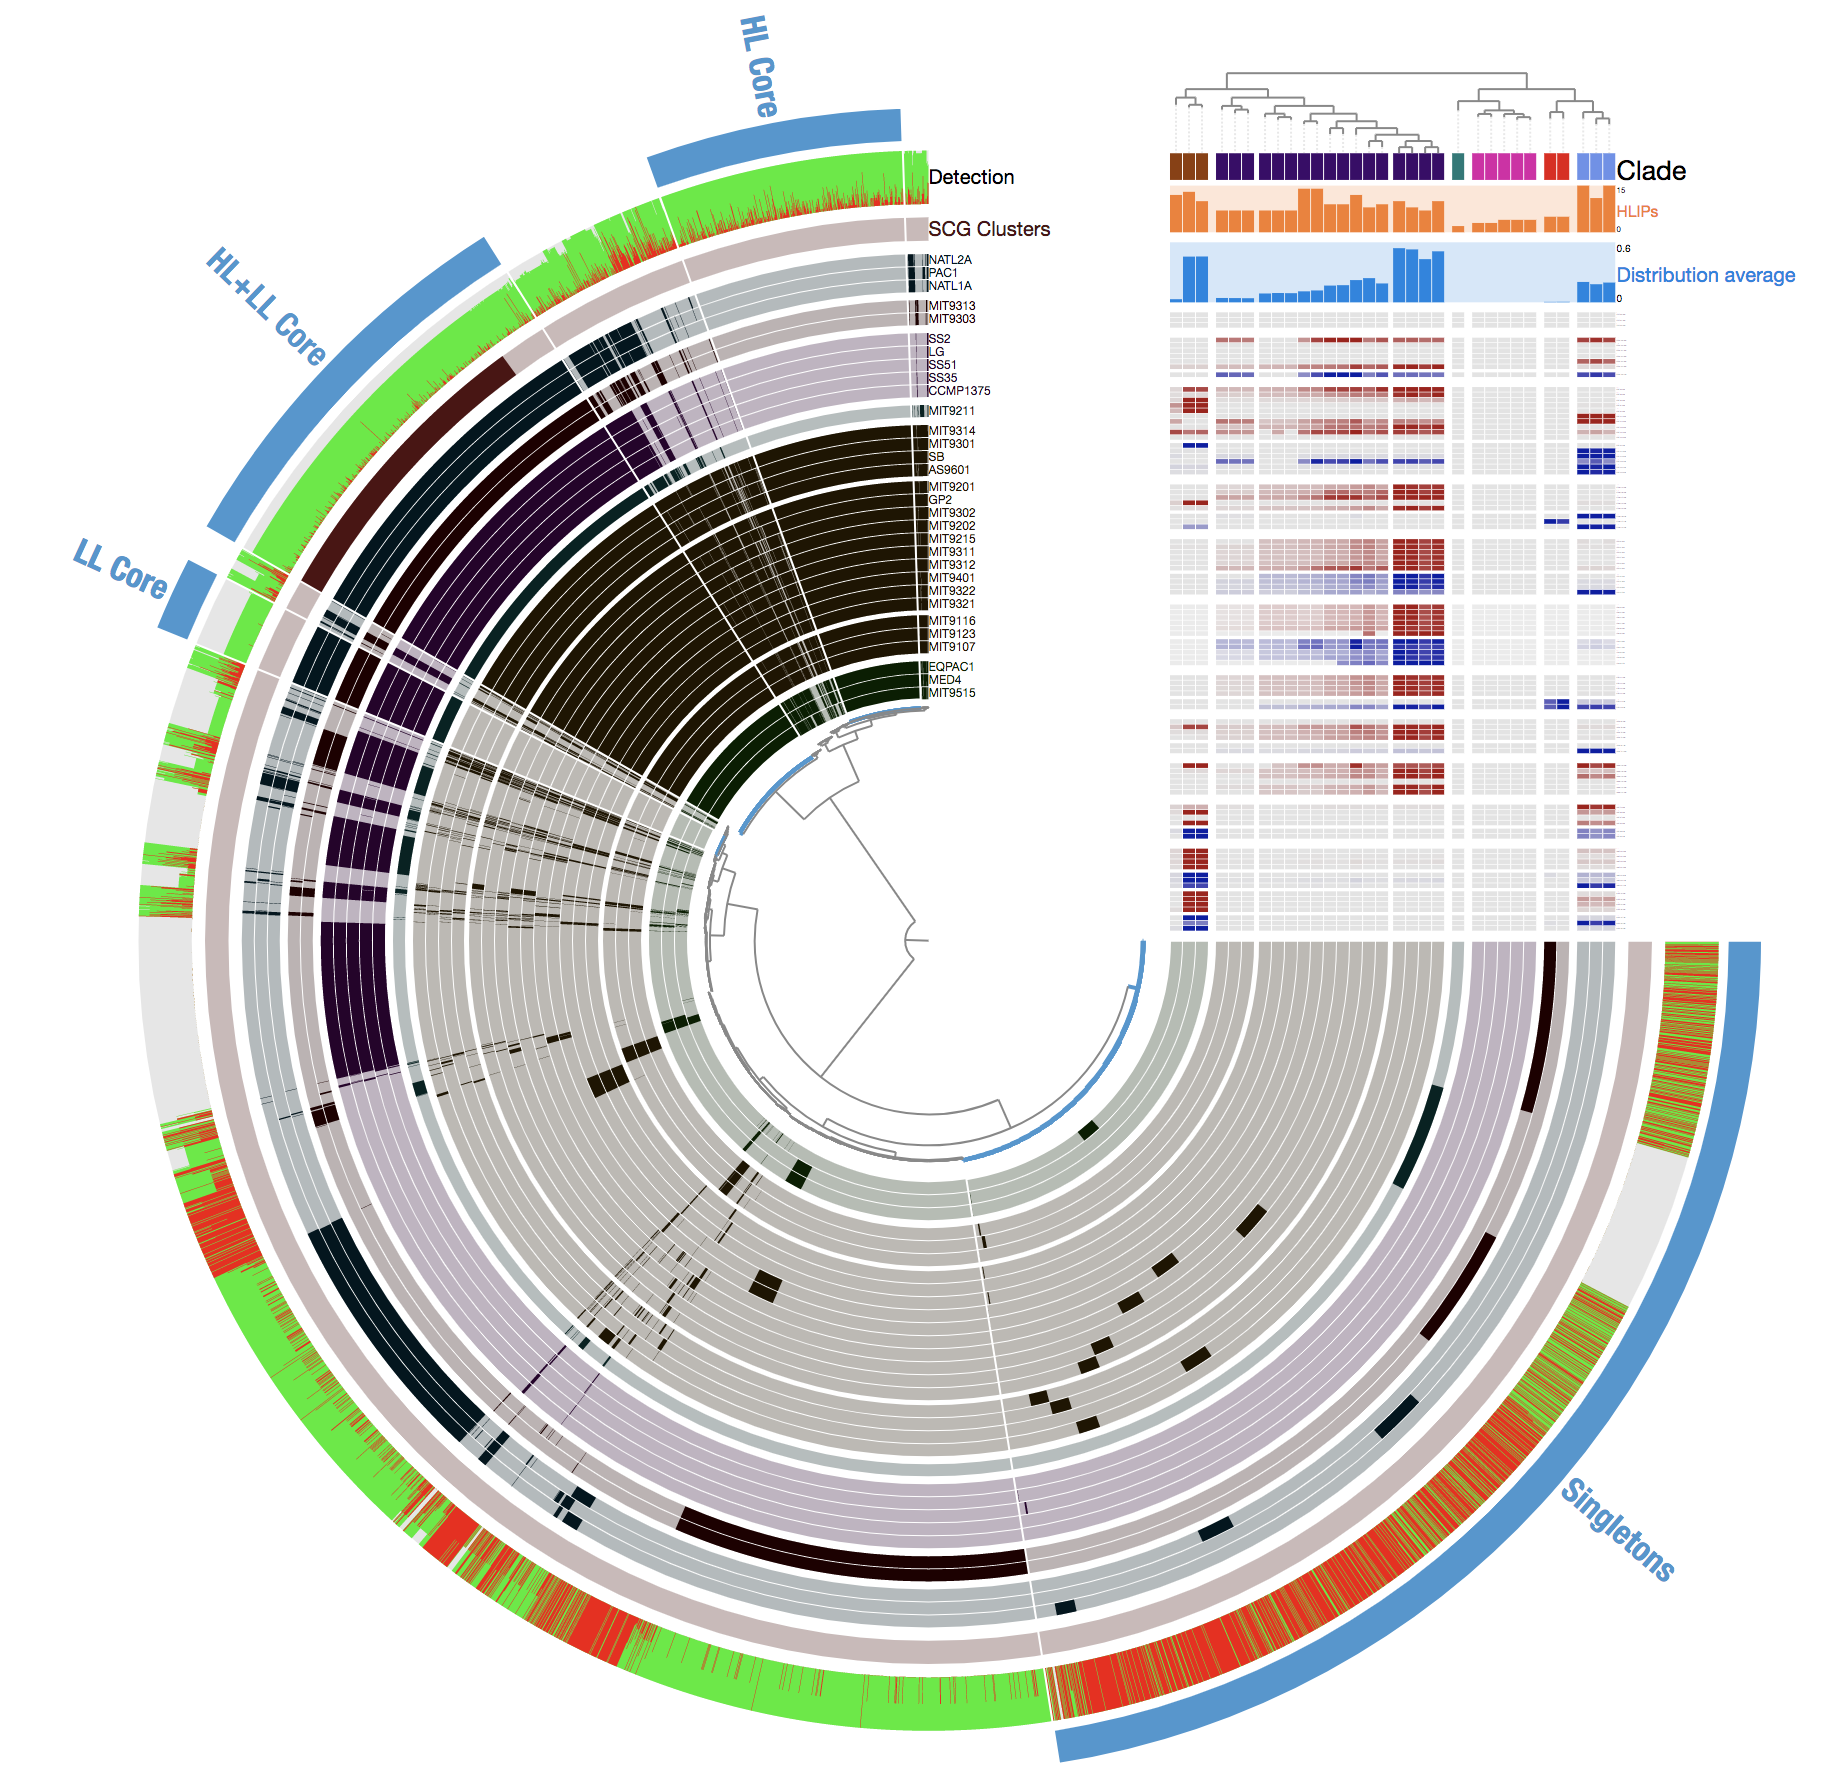
Please take a look at the published study, or read the avni’o pangenomics tutorial if you need to orient yourself to this display.
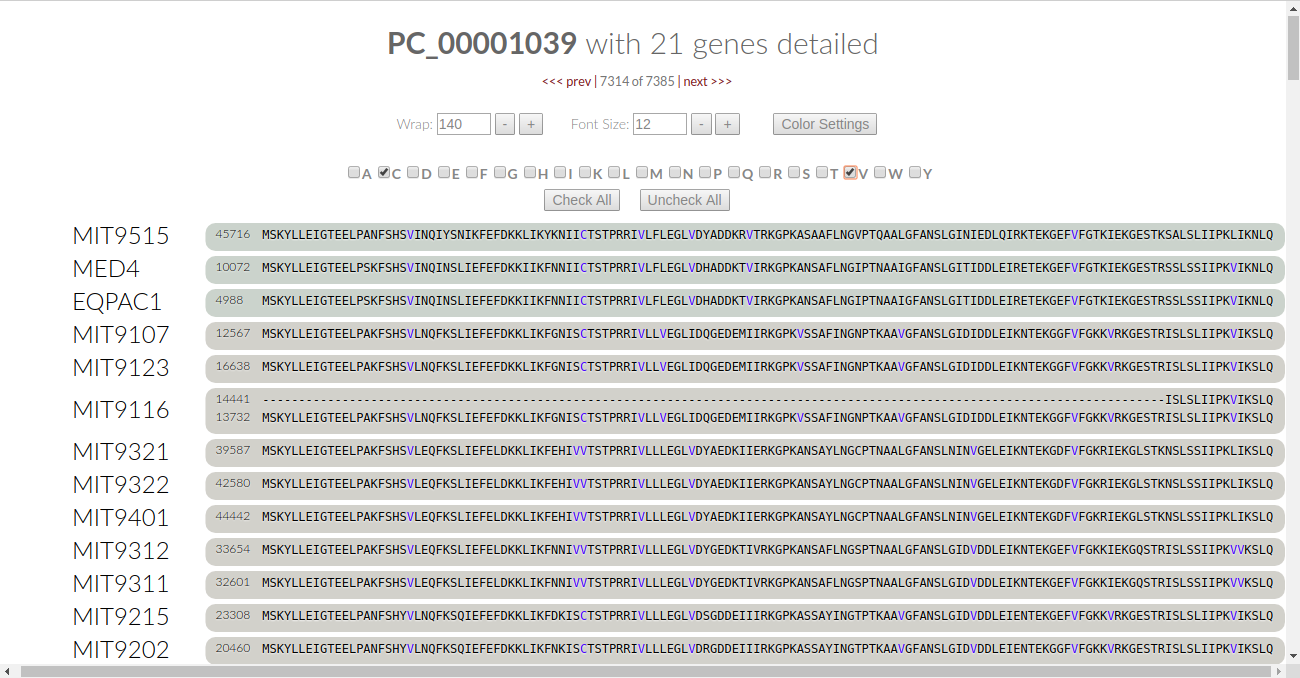
Those of you who are already familiar with anvi’o interactive displays, know that we can right-click any of the gene clusters in this display, and click on “inspect gene clusters” to see the amino acid sequence alignments. Here, an example with gene cluster 1039:
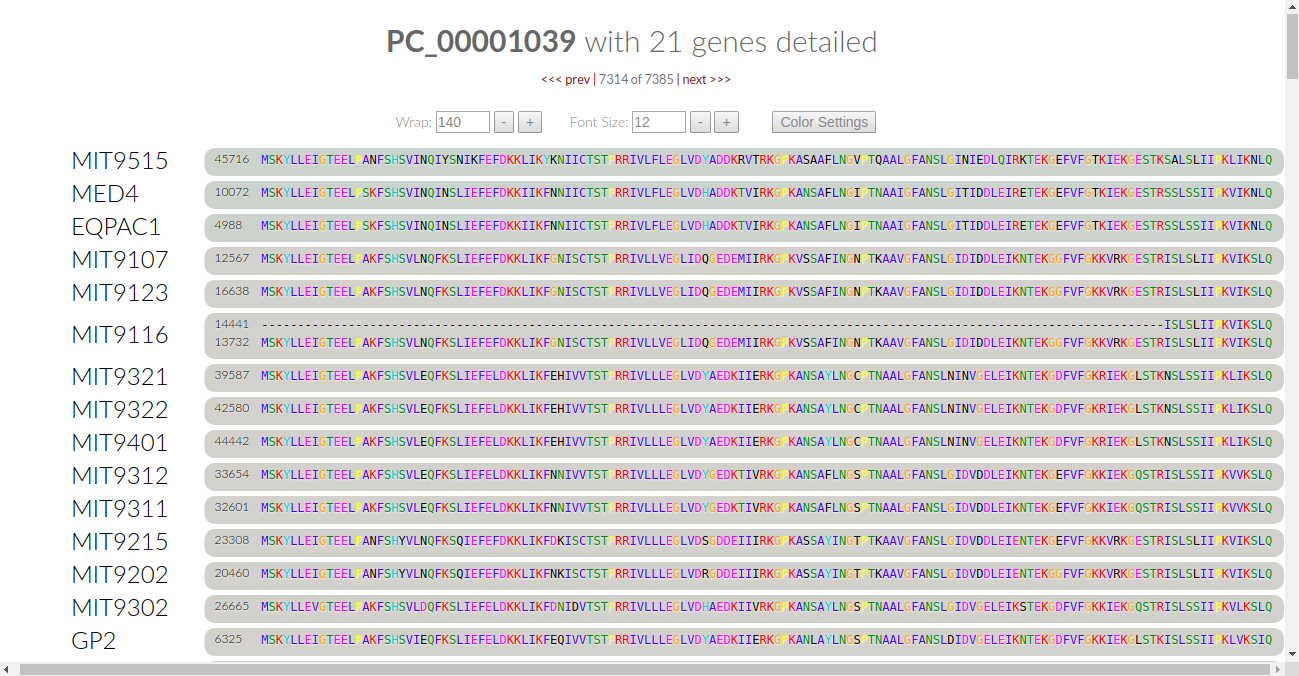
If you have used the anvi’o pangenomic workflow before v4, you will notice two differences. First, the amino acids are now printed in varying colors. Second, next to the controls for wrap and font size is now a button labelled “color settings”.
Click on it, and something else will pop up underneath these controls:
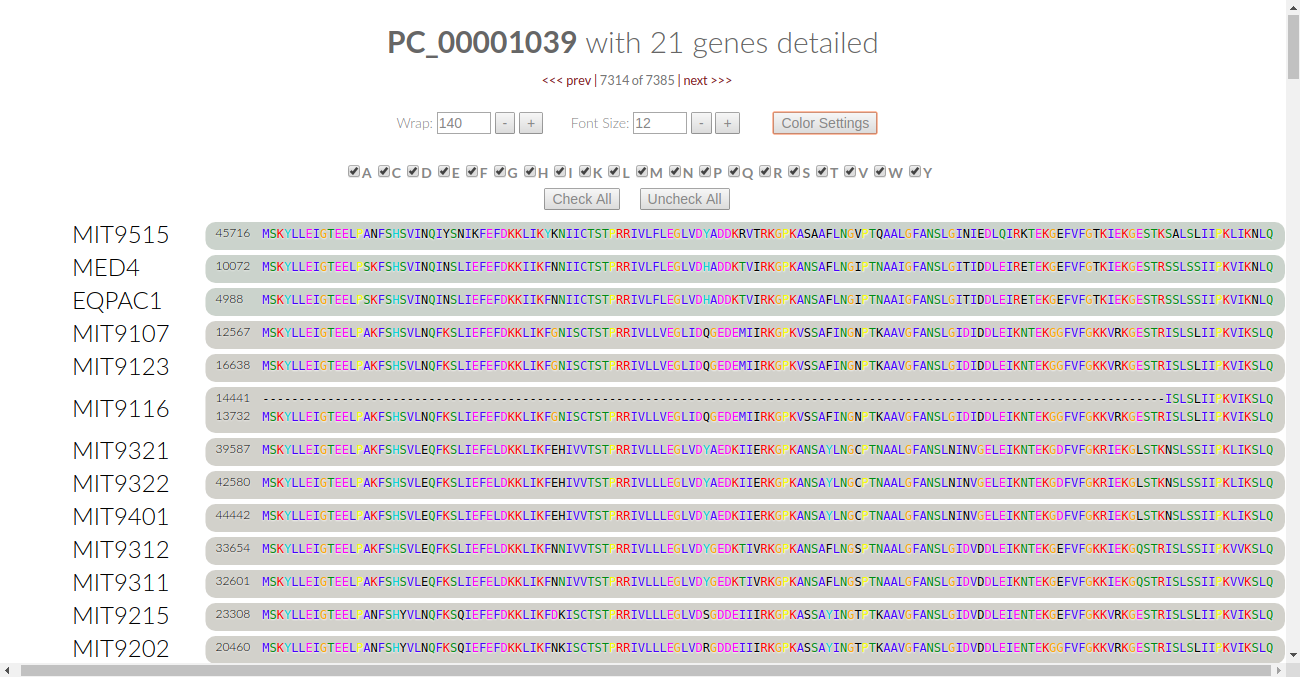
This is what we call “conservation controls”. The checkboxes tell us what amino acids are currently being checked for conservation by the algorithm. The two boxes below the checkboxes allow us to either select all or select none for the algorithm.
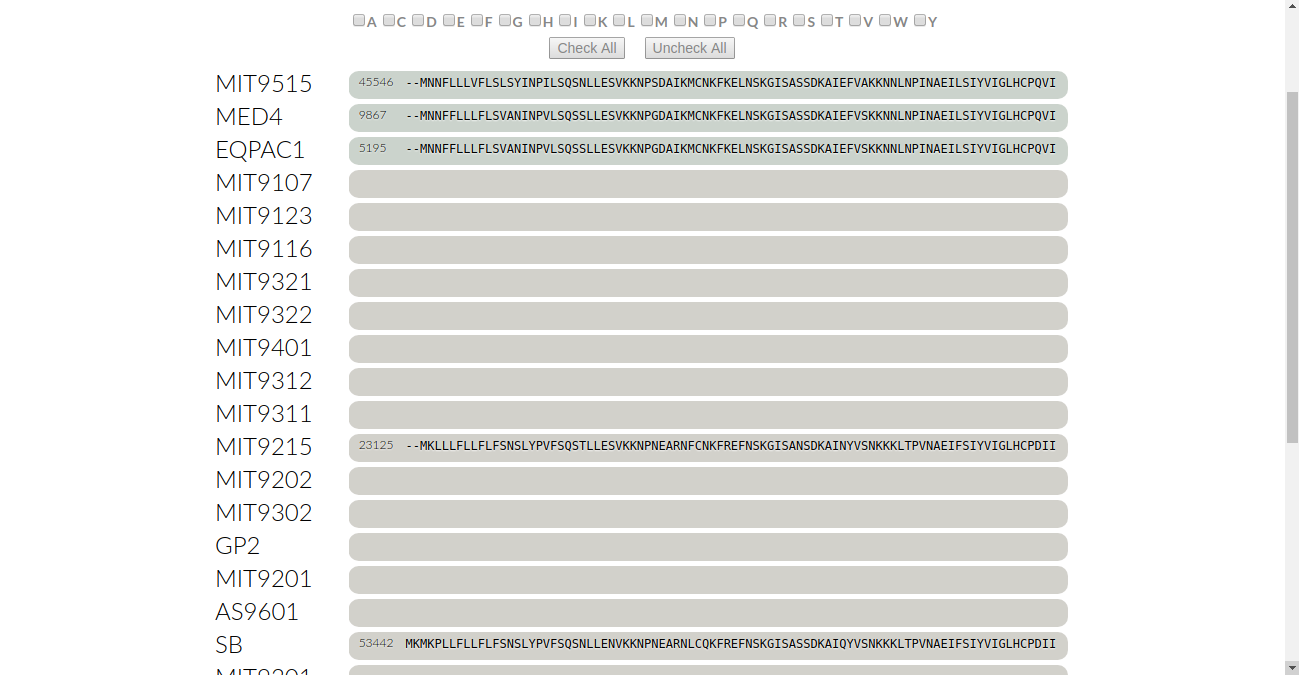
Are the colors too overwhelming to begin with? Let’s turn them all off and pause the algorithm. Click on the “uncheck all” button:
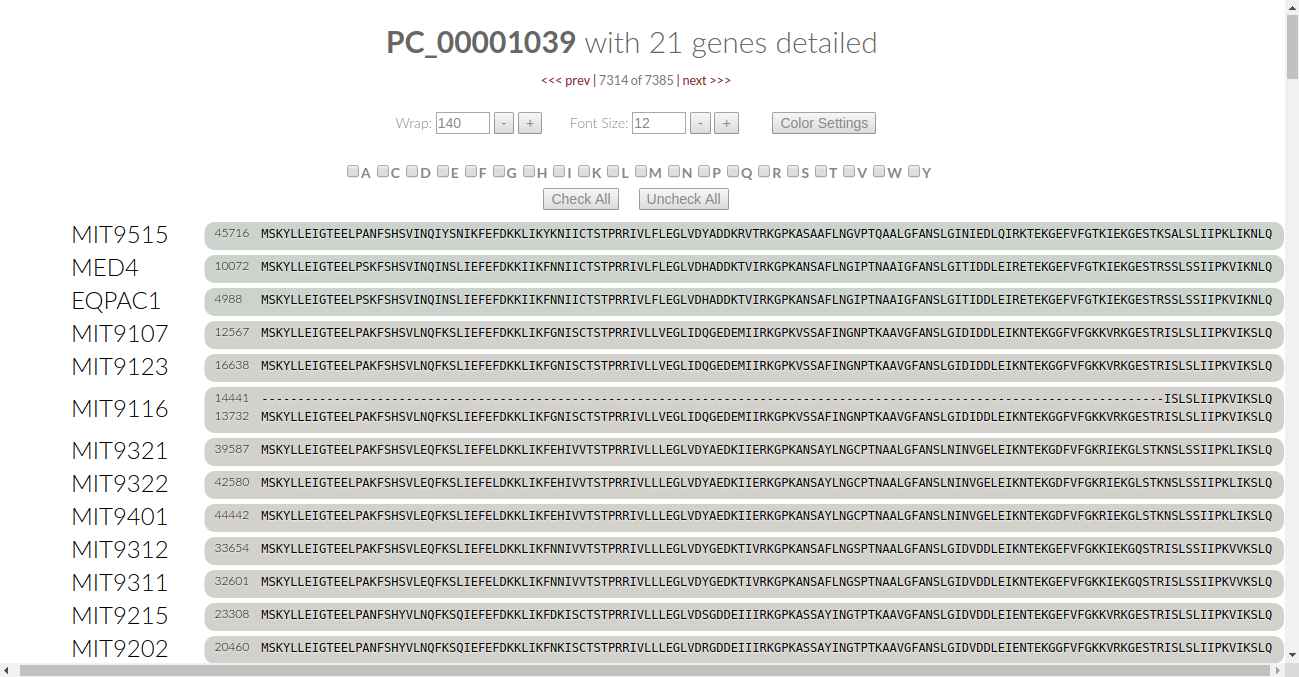
This turns the font color for all of the amino acids to black. We can be selective as to what amino acids we want the algorithm to check. Let’s say we want to check for the conservation of Cysteine. Click on the C checkbox and the algorithm automatically kicks in:

Let’s look at it - in our current viewing frame of the gene cluster, there is one place where cysteine is conserved. It’s colored in blue, and we notice that some of the genomes have a valine (V) in that residue. Is valine conserved here? Leaving “C” as it is, let’s click on “V” to find out:
Now we see that the valines are colored in blue, meaning that they are conserved in this residue. Therefore, we can say that all of the proteins in this gene cluster are conserved at this one residue through nonpolar effects.
Leaving everything as it is, scrolling down a little bit through this gene cluster will give us this:
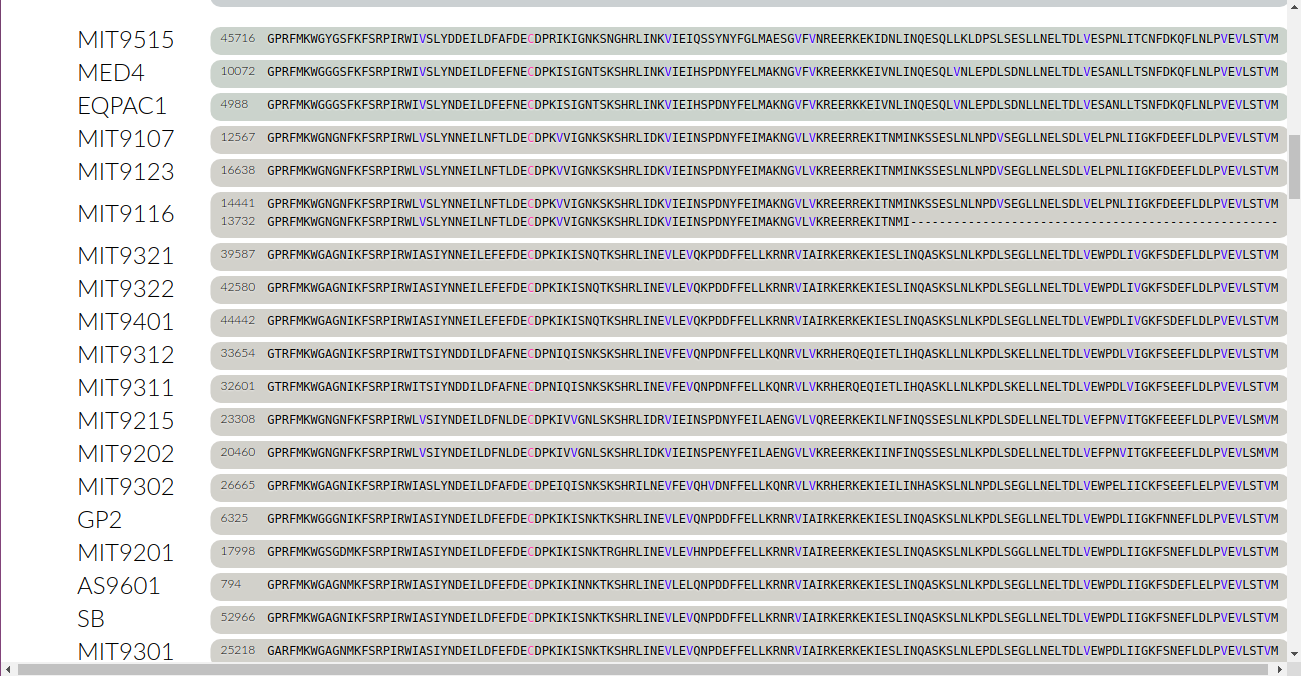
Here, cysteine is colored in pink instead of blue. We can then conclude that all of these genomes are conserved at this residue because of the special sulfide bonding effects of cysteine.
Play around with different amino acids and check for conservation in this gene cluster. If you want to check all of them, click on “check all” and the algorithm will automatically investigate conservancy for all of the amino acids across all genes.
Let’s look at gene cluster 2786 as another example.
Click on “Color Settings” and then “uncheck all” to bypass the algorithm (our screenshot is scrolled down slightly to capture all of the genomes in this gene cluster):
This time, we want to look at polar amino acids and see how they’re conserved in this gene cluster. As an example, let’s check for aspartate. Click on “D”:
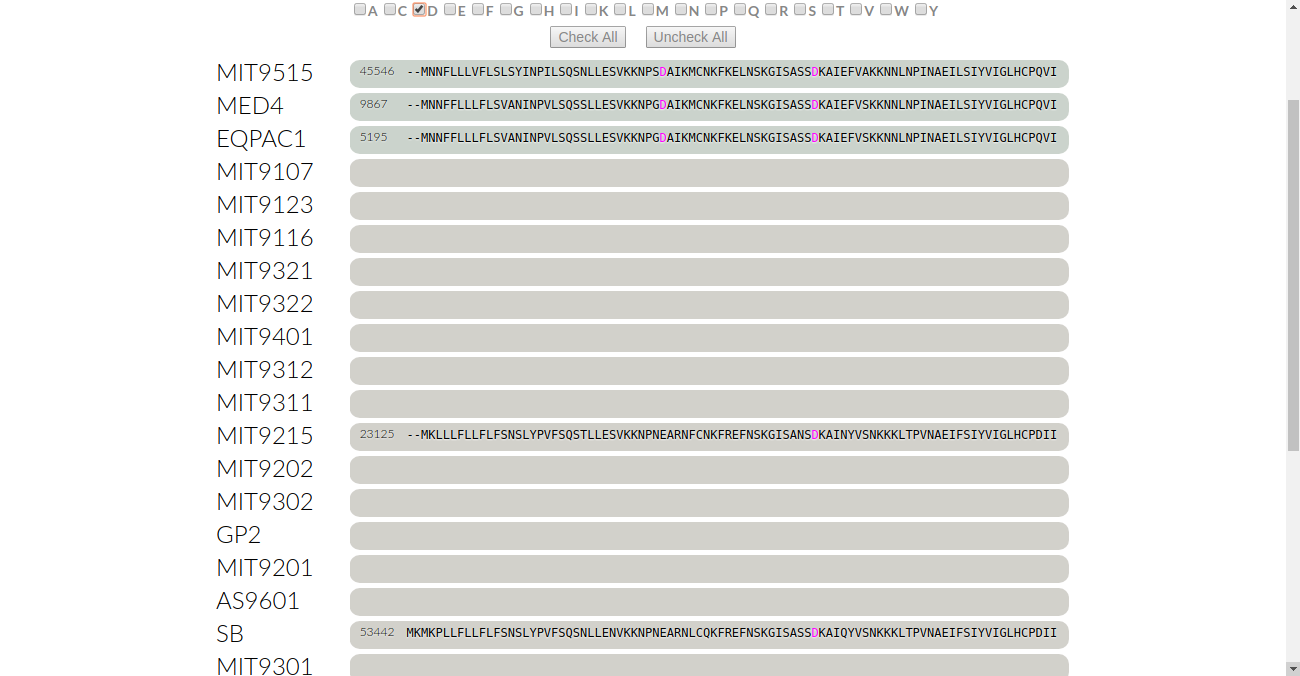
We see that a few aspartates are colored in magenta. But there’s two things to notice: firstly, MIT9125 and SB do not have aspartate in the same residue as the rest of the genomes. Secondly, these two genomes have aspartate in the third to last residue which isn’t colored in. We’ll take a look at these one by one.
To examine the first situation of MIT9125 and SB not having aspartate, we want to check for conservation with respect to the residue that they have. Looking down the line, we see that they both have glutamate “E”. Click on “E” to see if it is conserved:
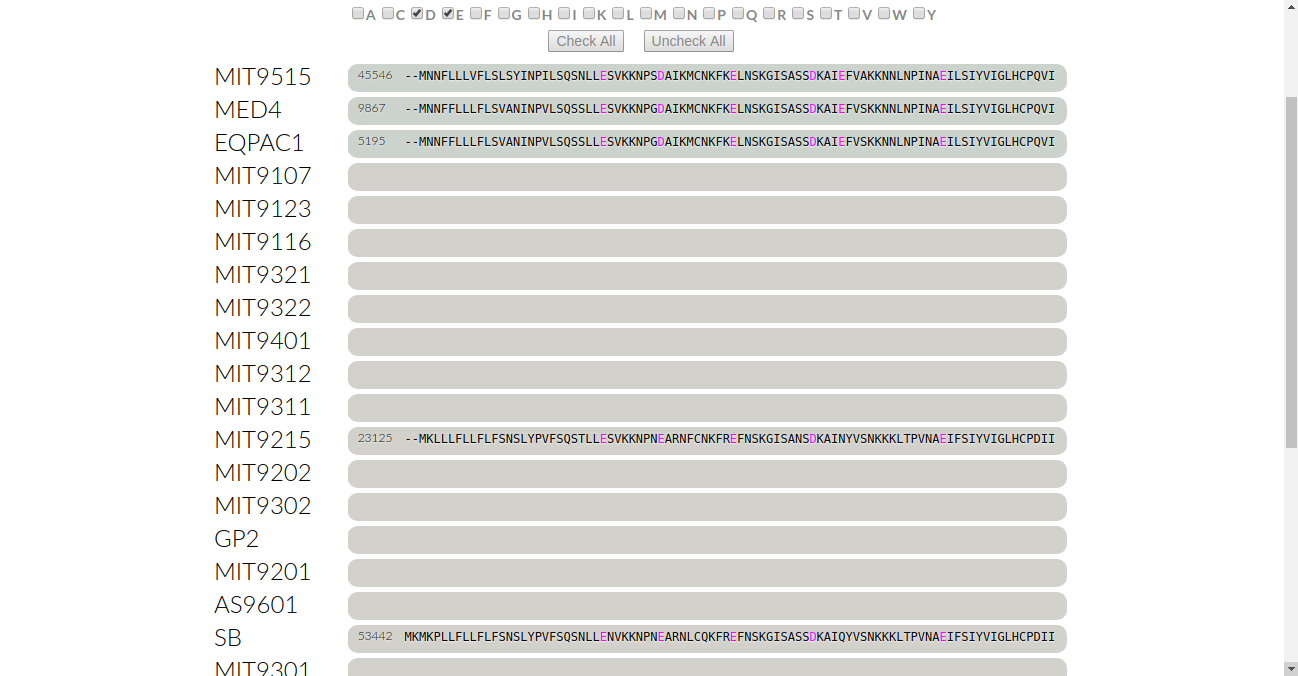
We see that both of the glutamates at this residue are colored. Thus, they are conserved because of negatively charged bonding effects (the magenta color). Now let’s look at the two aspartates that are not colored in. The remaining genomes have a glutamine “Q” in that residue. We’ll check for its conservation by clicking on “Q”:
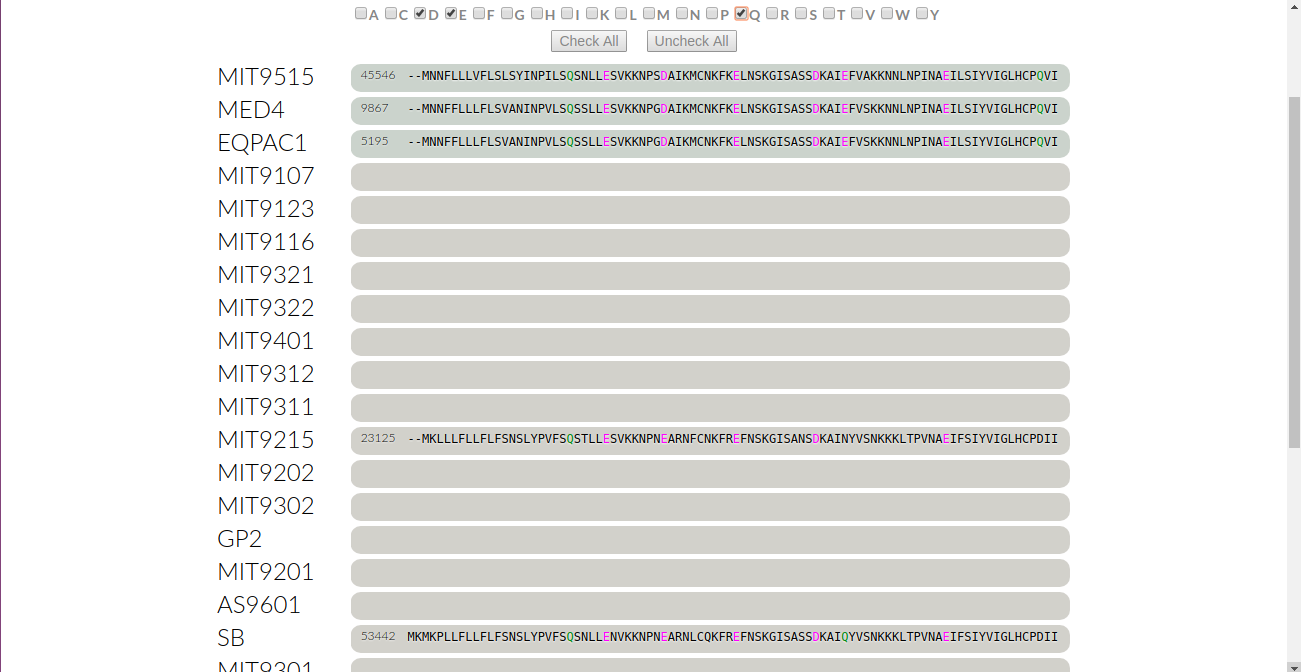
We notice that the glutamines are colored in green. This means that the glutamines are conserved with respect to nonpolar bonding with polar groups. This also means that aspartate is not conserved in this residue as it has a different bonding effect, telling us something about the conservancy of the protein between MIT9125 and SB compared to the remaining genomes.
That’s it! Very simple, and easy to learn.
I hope you will find this new feature useful for your own pangenomes.
Please feel free to let me know if there are any questions.